- calendar_month March 20, 2023
- folder Real Estate
Credit to JohnHart Real Estate, by Seth Styles

After last month’s dramatic (at least at first glance) absorption rates, February’s numbers seemed to move things back to a state of normalcy. Admittedly, “normal” for the Los Angeles housing market would still give a mechanical bull a run for its money. But our agents have learned to ride those bucks and dips without spilling a drop of their coffee. Though it was a much calmer month overall, we still have some notable moves to point out. We also have a couple of new places to add to the graph. Let’s welcome Upland and Rancho Cucamonga to the Absorption Rate Analysis! Besides the significant business we’ve been doing in these areas, we’re opening a new JohnHart location in Rancho Cucamonga! But before we get to the new kids, let’s check in with the familiar places.
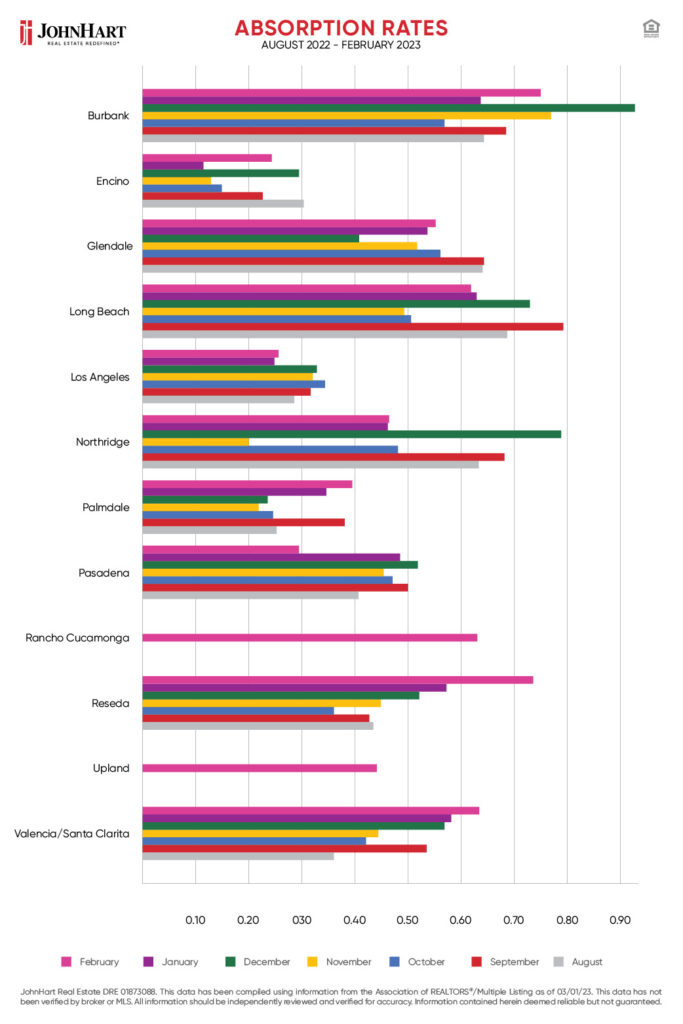
Absorption Rates – February 2023
- Los Angeles – 26%
- Glendale – 55%
- Burbank – 75%
- Northridge – 46%
- Long Beach – 62%
- Palmdale – 39%
- Encino – 24%
- Reseda – 74%
- Valencia/Santa Clarita – 63%
- Pasadena – 29%
- Rancho Cucamonga – 63%
- Upland – 44%
Absorption Rate FAQs
Really quickly, we’re going to run down our usual FAQs, but feel free to skip down to the next section if you’ve been here before.
- Why do you only count single family homes in your absorption rates?
Because that’s the best summation of our clients’ interests.
- What is an absorption rate?
It’s a statistic used to gauge whether a housing market favors a buyer or seller. In the U.S., a 20% absorption rate or higher is indicative of a seller’s market, meaning it favors the seller. A 15% absorption rate or lower is thought to indicate a buyer’s market. Of course, the neighborhoods in Los Angeles are unique, so these numbers are guides more than rules.
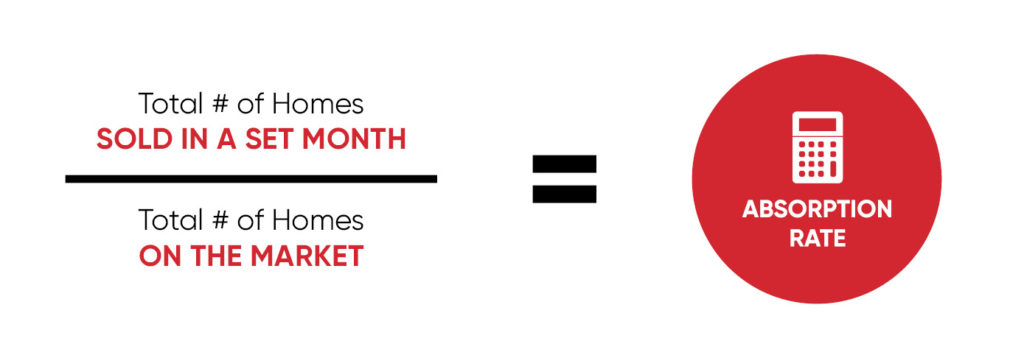
- How do you figure your absorption rates?
Using this universal formula:
A New Low for Pasadena
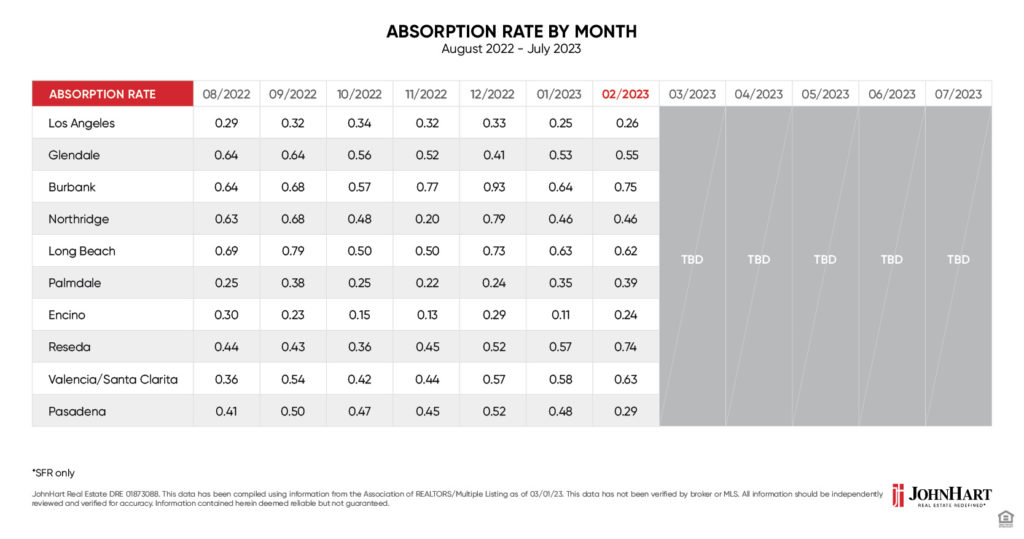
Only two neighborhoods dropped closer to a buyer’s market this week. One by a lot. One by a little. Long Beach barely nudged closer to the buyer’s market with its single percentage point drop. That still keeps it at a high 62% absorption rate (a.k.a. firmly in a seller’s market).
The big drop is somewhat of a surprise if we’re going strictly based on the tracking we’ve been sharing since August. Pasadena dropped 19% closer to a buyer’s market. That’s not a record-setting plunge. But it is the closest the community’s brushed with a buyer’s favor since we’ve been sharing these numbers.
Sure, Pasadena is still pretty strongly in the seller’s favor. But if you’ve been longing to live there, it might be a good time to start keeping your eye out.
Seven Seller Surges
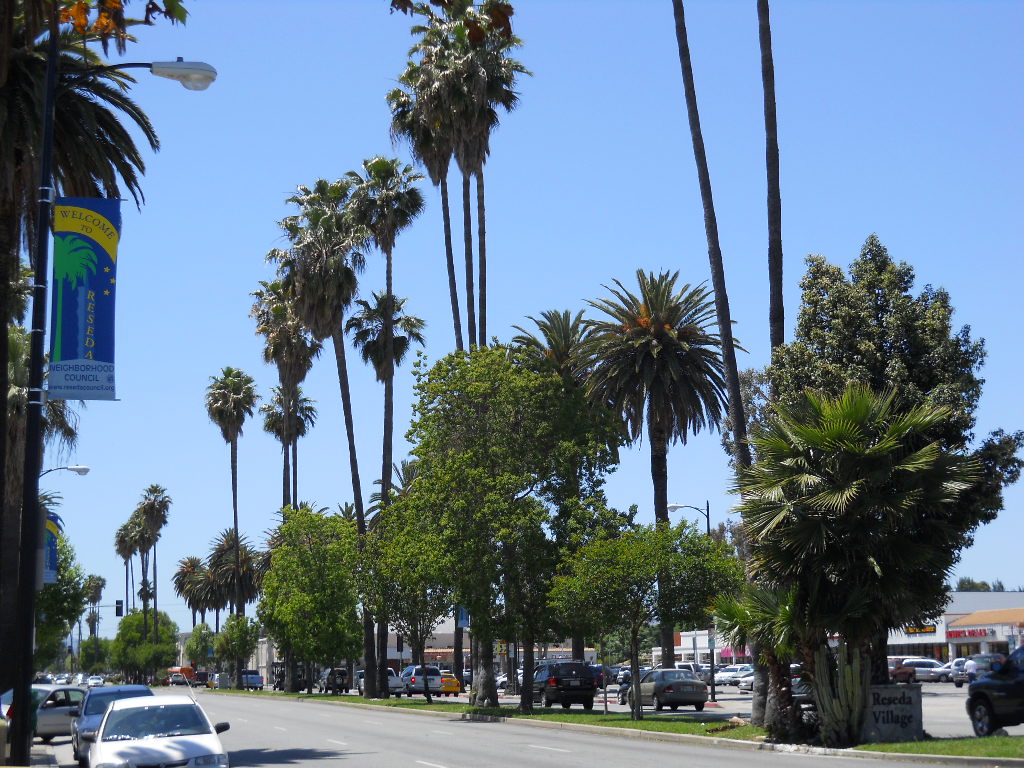
Photo credit: JGKlein
Last month revealed an inordinately low amount of surges compared to what we normally see. When we took a step back and looked at the bigger picture, it seemed more like course correction than anything. But it’s still worth noting that seven of the ten neighborhoods we’ve been tracking moved further into the seller’s favor in February.
The biggest surge happened in Reseda, where a 17% rise put it at a 74% absorption rate. That’s a pretty steep incline to the seller’s favor, putting it just a single percentage point behind February’s highest absorption rate (Burbank at 75%). It’s worth noting that Burbank also boasted the 3rd largest surge.
But the second largest absorption rate jump happened in Encino. If you’ll recall, Encino has spent the last few months creeping in and out of a buyer’s market. February’s surge of 13% puts it in the seller’s favor again. However, it’s still the lowest absorption rate of all the neighborhoods, so we’ll see if it makes it back to the buyer’s market. Much stranger things have happened.
Comparing to Absorption Rate Averages
Another interesting point of note: this month’s biggest surge and steepest drop put those neighborhoods out of step with their averages. Pasadena’s 29% absorption rate is a significant distance from its 45% average. And Reseda surging to 74% puts it at a far cry from its average of 46%. Are these flukes? Or are big things happening?
Rancho Cucamonga and Upland Enter the Analysis
Photo credit: Tobias Rochlitz
Now onto the latest additions to our charts. Statistically speaking, there’s not much to say about these two communities since this is our first month publicly sharing their data. But it will be interesting to watch how they perform alongside their Greater Los Angeles neighbors.
Rancho Cucamonga joins the chart at 63% while Upland joins at 44%. So far, both are very firmly in a seller’s market which puts them in comparable sales climates as all of our other communities. But if you’ve been paying attention, then you know anything can happen!
